


The Metrics That Actually Measure How Good a Website Is





The Metrics That Actually Measure How Good a Website Is
Ask two different people to judge whether a website is "good," and you'll often get two completely different answers, based on two completely different, unstated standards. A designer might judge it on visual polish. A developer might judge it on code quality and load speed. A marketer might judge it purely on conversion rate. None of these perspectives is wrong, exactly — but none of them alone actually answers the question completely, because a genuinely good website is good across several distinct dimensions simultaneously, and those dimensions are measured through entirely different sets of metrics.
This is a more consequential gap than it might first appear. A business relying on the wrong metric — or only one metric — to judge its own website can walk away with a false sense of confidence, or worse, chase improvements in a dimension that was never actually the problem. Understanding the real, complete set of metrics that determine whether a website is genuinely performing well — not just looking good — is the foundation for making informed decisions about where to actually invest improvement effort.
Why No Single Metric Tells the Whole Story
Different Metrics Answer Different Questions
A website can have excellent performance metrics and still fail to convert visitors into customers. It can convert visitors well while quietly struggling with search visibility, meaning far fewer people ever find it in the first place. It can rank well in search and convert reasonably, while still carrying poor accessibility or usability that frustrates a meaningful share of visitors in ways that never show up clearly in the primary metrics being tracked. Each category of metric answers a genuinely different question, and a complete picture of website quality requires looking across all of them together, not picking a favorite and treating it as sufficient on its own.
The Categories Worth Tracking
Broadly, the metrics that meaningfully measure website quality fall into a handful of categories:
- Traffic and visibility metrics
- Engagement and behavior metrics
- Conversion and business outcome metrics
- Technical performance metrics
- Usability and accessibility metrics
- SEO health metrics
Each of these is examined below, along with what a business should actually look for within it.
Traffic and Visibility Metrics
What This Category Measures
Traffic metrics answer a foundational question: are people actually finding the website in the first place? A website could be exceptionally well built in every other respect and still fail the business entirely if almost nobody ever reaches it.
Key Metrics in This Category
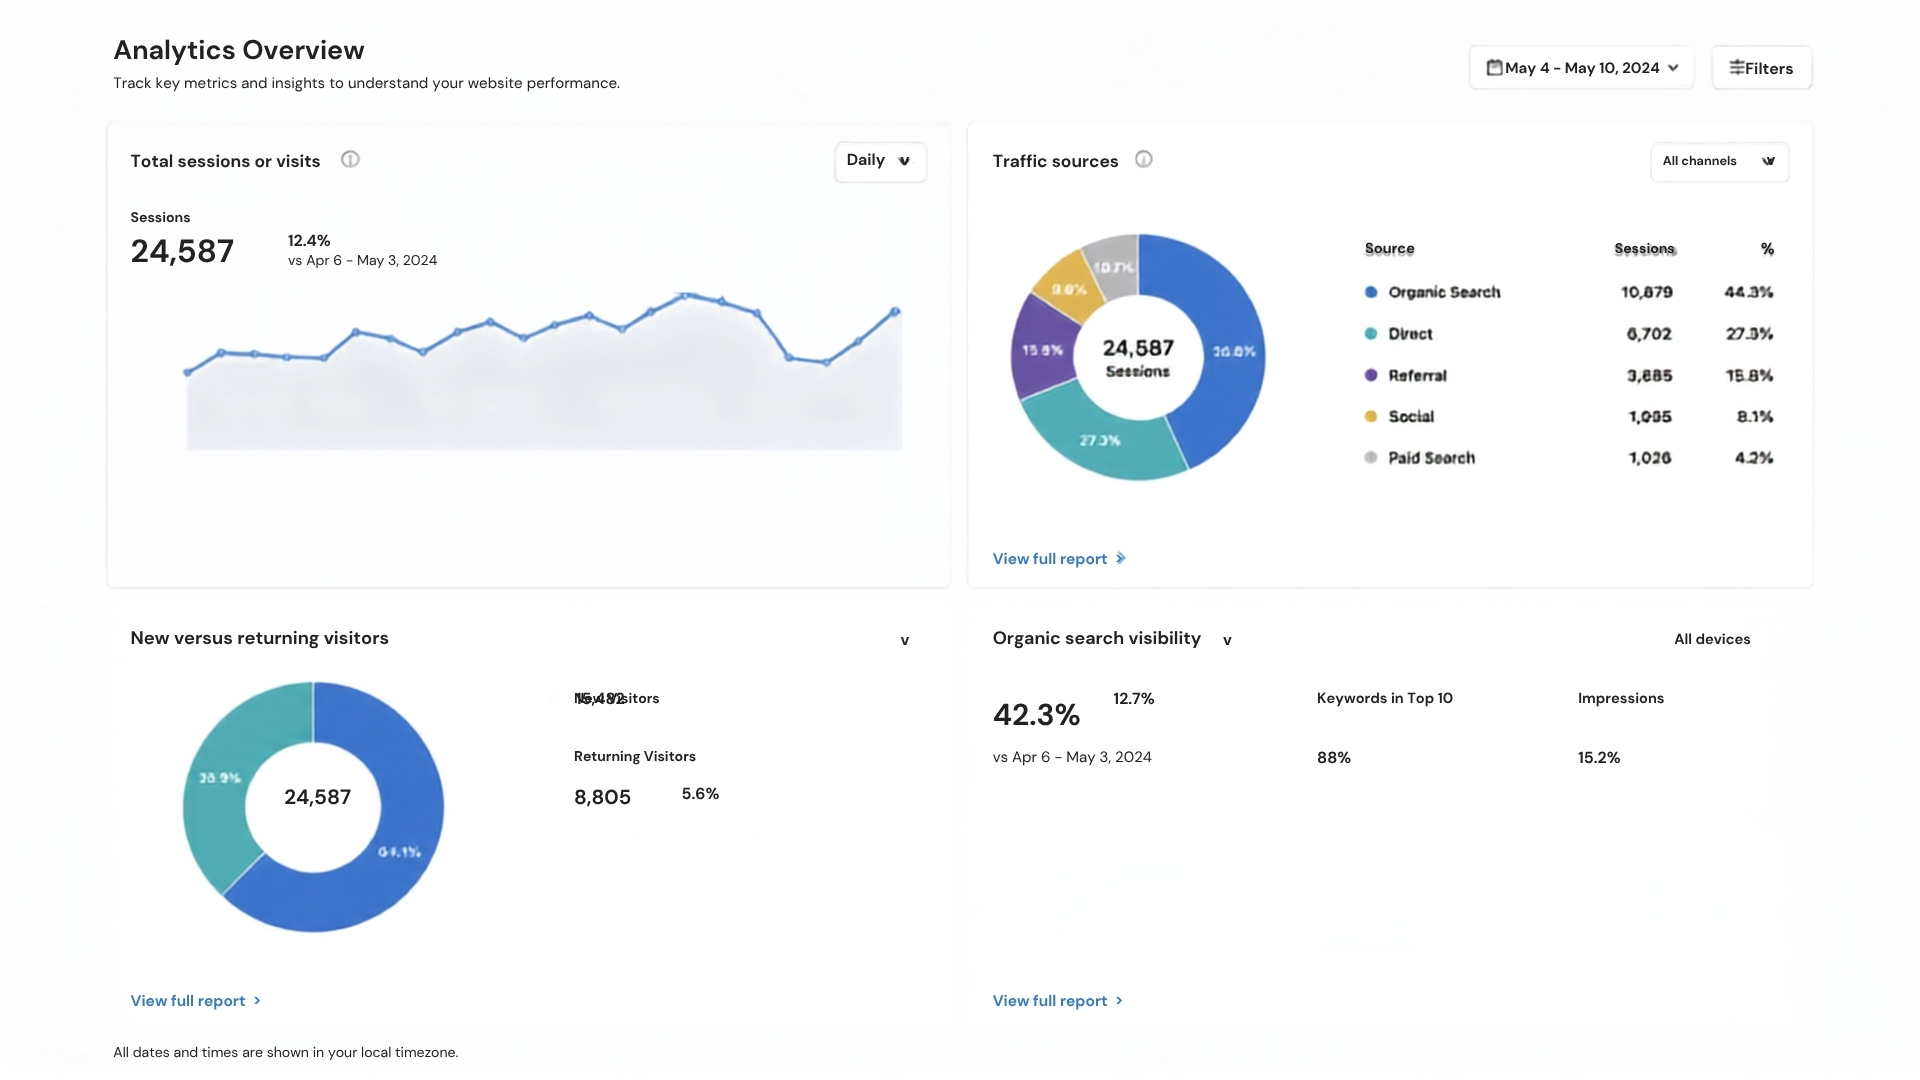
- Total sessions or visits — the overall volume of traffic a site receives over a given period, providing a baseline sense of scale and growth over time.
- Traffic sources — the breakdown of where visitors originate (organic search, paid advertising, social media, direct visits, referrals from other sites), which reveals which channels are actually driving discovery.
- New versus returning visitors — the split between first-time visitors and people coming back, which reflects both how well a site attracts new interest and how well it retains engagement over time.
- Organic search visibility — how often a site appears in search results for relevant terms, and how much of that visibility translates into actual clicks, typically tracked through tools like Google Search Console.
Why This Category Alone Isn't Sufficient
A site can have strong, growing traffic and still be a poor website in every practical sense if that traffic doesn't lead anywhere useful once it arrives — which is exactly why traffic metrics need to be evaluated alongside, not instead of, the engagement and conversion metrics that follow.
Engagement and Behavior Metrics
What This Category Measures
Engagement metrics reveal what visitors actually do once they arrive — whether they explore, whether they stay, and whether the site is holding their attention in a way that suggests genuine interest rather than immediate disinterest.
Key Metrics in This Category
- Bounce rate — the percentage of visitors who leave after viewing only a single page without taking any further action, a rough (though imperfect) signal of whether a landing experience matched what a visitor was expecting.
- Average session duration — how long visitors typically spend on the site per visit, which can indicate genuine engagement, though it needs context, since a long session on a support page might indicate confusion rather than satisfaction.
- Pages per session — how many distinct pages a visitor views during a single visit, often reflecting how effectively internal navigation and content encourage further exploration.
- Scroll depth — how far down a page visitors actually scroll, revealing whether content lower on a page is being seen at all or largely ignored.
- Exit pages — the specific pages where visitors most frequently leave the site, which can highlight points of friction, confusion, or natural completion (like a thank-you page after a purchase) depending on context.
An Important Nuance in Interpreting This Category
A high bounce rate isn't automatically a bad sign — a visitor who searches for a simple factual answer, finds it immediately on a single page, and leaves satisfied technically counts as a "bounce," even though the experience was arguably a complete success. A blog publishing quick-answer content, for instance, often has structurally higher bounce rates than an ecommerce site with a multi-step purchase journey, without that necessarily reflecting worse website quality — interpreting engagement metrics correctly requires understanding what a "good" outcome actually looks like for that specific type of page and visitor intent.
Conversion and Business Outcome Metrics
What This Category Measures
This is, for most businesses, the category that ultimately matters most, since it connects website performance directly to actual business results rather than intermediate signals of interest or engagement.
Key Metrics in This Category
- Conversion rate — the percentage of visitors who complete a defined goal action (a purchase, a form submission, a phone call, a signup), the single most direct measure of whether a website is actually accomplishing its core purpose.
- Cost per conversion — for sites driving traffic through paid channels, how much it costs on average to generate a single conversion, essential for evaluating overall marketing efficiency.
- Average order value or transaction value — for ecommerce specifically, the average amount spent per completed purchase, relevant to understanding overall revenue impact beyond raw conversion count alone.
- Cart or form abandonment rate — the percentage of visitors who begin, but don't complete, a checkout or form process, highlighting friction points late in a conversion journey.
- Return on investment (ROI) — the overall financial return generated relative to the cost of running and marketing the website, ultimately the metric most directly tied to whether the website is a genuinely good business asset.
Why This Is the Category Businesses Should Weight Most Heavily
A website with modest traffic but a strong conversion rate can meaningfully outperform, in actual business terms, a much higher-traffic site that converts poorly — which is exactly why chasing traffic growth in isolation, without attention to conversion performance, often fails to translate into meaningful business results even when the traffic numbers themselves look impressive.
Technical Performance Metrics
What This Category Measures
Technical performance metrics assess the underlying speed, stability, and responsiveness of a website — factors that affect both user experience directly and search engine rankings, since search engines explicitly factor performance metrics into how they evaluate page quality.
Key Metrics in This Category
- Page load time — the overall time it takes for a page to become usable, a foundational performance measure affecting both user patience and conversion likelihood.
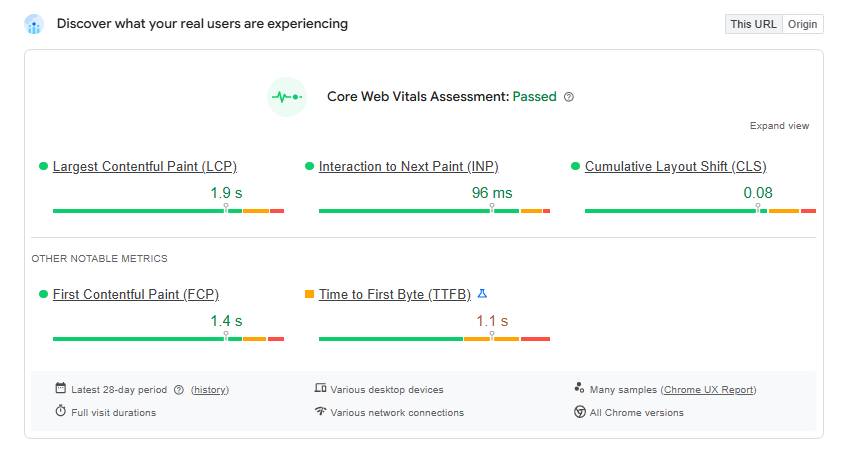
- Core Web Vitals — a specific, standardized set of Google-defined metrics (Largest Contentful Paint, Interaction to Next Paint, and Cumulative Layout Shift) measuring real-world loading speed, interactivity, and visual stability.
- Uptime percentage — the proportion of time a website is actually accessible and functioning, with even small amounts of downtime potentially costing meaningful traffic and revenue depending on when they occur.
- Mobile performance scores — performance measured specifically on mobile devices and connections, which often differ meaningfully from desktop performance and matter enormously given how much traffic now originates from mobile.
- Server response time — how quickly a server begins responding to a request, an early technical indicator affecting overall perceived speed.
A retail site running a major promotional campaign, for example, might see technically strong conversion rates during normal periods but suffer a measurable performance and revenue hit during a high-traffic sale event if its hosting infrastructure and page speed weren't adequately tested and optimized to handle that traffic spike — illustrating why technical performance metrics need ongoing monitoring, not a single one-time check, since real-world conditions and traffic volume change over time.
Usability and Accessibility Metrics
What This Category Measures
Usability and accessibility metrics assess how easily and equitably people can actually use a website — a dimension that's harder to capture through standard analytics alone and often requires more deliberate, direct evaluation methods.
Key Metrics and Evaluation Methods in This Category
- Task success rate — in formal usability testing, the percentage of test users who successfully complete a defined task (finding a specific piece of information, completing a purchase) without significant difficulty.
- Time on task — how long it takes users to successfully complete a given task, with unexpectedly long times often indicating confusing navigation or unclear content.
- Accessibility compliance scores — measured against established standards like WCAG (Web Content Accessibility Guidelines), assessing whether a site is genuinely usable by people with visual, auditory, motor, or cognitive impairments.
- Customer satisfaction and usability surveys — direct, qualitative feedback from real users about their experience, capturing nuance that purely quantitative metrics sometimes miss.
- Heatmaps and session recordings — visual tools showing where users click, how far they scroll, and how they actually move through a page, often revealing usability friction points that standard numerical metrics alone don't fully explain.
Why This Category Is Often Underweighted
Usability and accessibility issues frequently don't show up clearly in standard analytics — a confusing navigation structure might not produce an obviously alarming bounce rate number, but it can still be quietly costing a meaningful share of potential conversions from users who simply couldn't figure out how to complete what they came to do. This is exactly why direct usability testing and qualitative feedback remain valuable even for businesses already tracking extensive quantitative analytics.
SEO Health Metrics

What This Category Measures
SEO health metrics assess how well a website is positioned to be found and favorably ranked by search engines — related to, but distinct from, the raw traffic metrics discussed earlier, since these metrics focus more on underlying technical and content health rather than just resulting visitor volume.
Key Metrics in This Category
- Keyword rankings — a site's position in search results for specific, relevant target terms, tracked over time to assess whether SEO efforts are producing measurable improvement.
- Organic click-through rate — the percentage of people who see a listing in search results and actually click on it, reflecting how compelling and relevant a listing appears relative to competing results.
- Backlink count and quality — the number and credibility of external websites linking back to a site, a significant off-page authority signal.
- Crawl errors and indexing issues — technical problems preventing search engines from properly accessing or including specific pages, often invisible without direct monitoring through tools like Google Search Console.
- Domain authority (a third-party estimated metric) — an overall estimated measure of a website's general search authority and trustworthiness relative to other sites, useful as a directional benchmark though not an official metric search engines themselves publish or use directly.
Bringing These Categories Together Into a Complete Picture
Why Weighting Matters More Than Any Single Score
None of these categories, taken alone, fully answers whether a website is genuinely good — a complete evaluation requires looking across traffic, engagement, conversion, technical performance, usability, and SEO health together, and understanding how they relate to each other. A decline in conversion rate might actually trace back to a technical performance issue slowing down checkout, which itself might trace back to a recent content or code change — meaning these categories aren't independent silos, but interconnected layers where a problem in one often surfaces as a symptom in another.
Prioritizing Based on Business Goals
The relative importance of each category also shifts depending on a business's specific goals and current stage. A brand-new website with very little traffic yet has more urgent work to do in the traffic and SEO health categories before conversion optimization becomes the most valuable focus, since there's limited traffic volume yet to meaningfully test and improve conversion against. An established website with strong, steady traffic but a conversion rate that's plateaued or declining should generally prioritize investigating engagement, usability, and technical performance metrics, since the traffic problem has already largely been solved and the more valuable opportunity lies in converting the existing traffic more effectively.